Technical Implementation
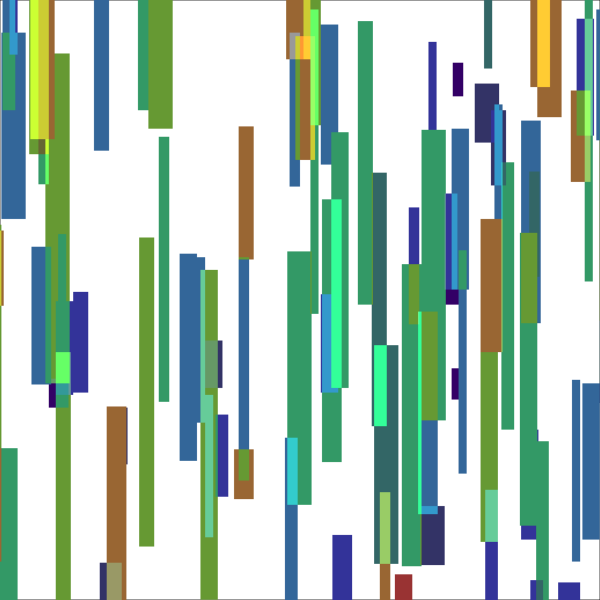
This piece was inspired by Marius Watz’s Blocker series. The code draws semi-transparent rectangles with colors and positions determined by Perlin noise. The final color palette is a blend from separate noise patterns.
library(ambient)
library(viridis)

# create a blank canvas
width <- 2000
height <- 1000
img1 <- matrix(0, nrow = height, ncol = width)
img2 <- matrix(0, nrow = height, ncol = width)

# generate perlin noise
noise <- noise_perlin(c(height, width), frequency = 0.05)

# function to draw a random vertical rectangle with a specified color map
draw_rectangle <- function(img1, img2, noise) {

    # generate random position, width, and height
    x <- sample(1:width, 1)
    w <- sample(1:10, 1)

    y <- round(sample(1:height, 1) + rnorm(1, sd=5)) + 1
    h <- sample(1:150, 1)

    x0 <- max(1, x-w)
    x1 <- min(x+w, width)
    y0 <- max(1, y-h)
    y1 <- min(y+h, height)

    # get the average noise value within the rectangle
    noise_value <- mean(noise[y0:y1, x0:x1])

    # map the noise value to a color index
    color_index <- round(noise_value * 255) + 200

    # calculate the opacity based on the area (smaller rectangles have higher opacity)
    if (runif(1) > 0.1)
        opacity <- 1 - exp(-(h + w) / 100)
    else
        opacity <- exp(-(h + w) / 1000)

    # create a semi-transparent rectangle with the corresponding color
    rect <- opacity * matrix(color_index, nrow=y1-y0+1, ncol=x1-x0+1)

    # randomly select the color map for the rectangle
    if (runif(1) < 0.5) {
        img1[y0:y1, x0:x1] <- (1 - opacity) * img1[y0:y1, x0:x1] + opacity * rect
    } else {
        img2[y0:y1, x0:x1] <- (1 - opacity) * img2[y0:y1, x0:x1] + opacity * rect
    }

    return(list(img1, img2))
}

# generate the images by drawing multiple rectangles
set.seed(123)
for (i in 1:750) {
    result <- draw_rectangle(img1, img2, noise)
    img1 <- result[[1]]
    img2 <- result[[2]]
}

for (palettes in list(c(turbo, mako), c(viridis, inferno), c(mako, viridis))) {

    # apply the first color palette to img1
    img_color1 <- col2rgb(palettes[[1]](256)[round(img1) + 1]) / 255
    dim(img_color1) <- c(3, dim(img1))

    # apply the second color palette to img2
    img_color2 <- col2rgb(palettes[[2]](256)[round(img2) + 1]) / 255
    dim(img_color2) <- c(3, dim(img2))

    # combine the two color-mapped images
    blend_weight <- 0.5
    img_blended <- pmin(blend_weight * img_color1 + (1 - blend_weight) * img_color2, 1.0)
    img_blended <- round(img_blended/0.2)*0.2

    # display the combined image
    par(mar = c(0, 0, 0, 0), oma=c(0, 0, 0, 0))
    plot(0, 0, type = "n", xlim = c(0, 1), ylim = c(0, 1), xaxt = "n", yaxt = "n", ann=F, axes=F)
    rasterImage(aperm(img_blended, perm=c(2, 3, 1)), 0, 0, 1, 1)
}
