Technical Implementation
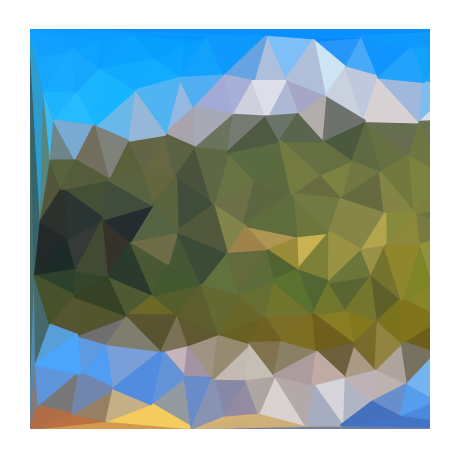
The algorithm uses Poisson disk sampling to generate well-distributed points, which are then used to create a triangular mesh via Delaunay triangulation. Each triangle in this mesh is filled with the average color of the corresponding area in the original image.
- Delaunay triangulation is a mathematical technique that maximizes the minimum angle of all triangles in a mesh. This creates a more aesthetically pleasing and structurally sound triangulation compared to other methods.
- Poisson disk sampling is a method for generating well-distributed points in a given area. It is often used in computer graphics and computational geometry to create realistic-looking patterns and textures.
import numpy as np
import matplotlib.pyplot as plt
from matplotlib.patches import Polygon
from matplotlib.collections import PatchCollection
from scipy.spatial import Delaunay, distance


def generate_poisson_points(width, height, n_points=2500, min_dist=20, n_trys=100, seed=None):

    np.random.seed(seed)

    # initialize
    cell_size = min_dist / np.sqrt(2)
    grid_width = int(np.ceil(width / cell_size))
    grid_height = int(np.ceil(height / cell_size))
    grid = np.full((grid_width, grid_height), -1, dtype=int)

    points = []
    active_list = []
    x = np.random.uniform(0, width)
    y = np.random.uniform(0, height)
    points.append([x, y])
    active_list.append(0)
    grid_x, grid_y = int(x / cell_size), int(y / cell_size)
    grid[grid_x, grid_y] = 0

    # sample
    while active_list and len(points) < n_points:
        idx = np.random.choice(active_list)
        base_x, base_y = points[idx]

        for _ in range(n_trys):
            angle = np.random.uniform(0, 2 * np.pi)
            d = np.random.uniform(min_dist, 2 * min_dist)
            new_x = base_x + d * np.cos(angle)
            new_y = base_y + d * np.sin(angle)

            if 0 <= new_x < width and 0 <= new_y < height:
                grid_x, grid_y = int(new_x / cell_size), int(new_y / cell_size)
                if grid[grid_x, grid_y] == -1:
                    valid = True
                    for dx in [-1, 0, 1]:
                        for dy in [-1, 0, 1]:
                            nx, ny = grid_x + dx, grid_y + dy
                            if 0 <= nx < grid_width and 0 <= ny < grid_height:
                                if grid[nx, ny] != -1:
                                    px, py = points[grid[nx, ny]]
                                    if distance.euclidean([new_x, new_y], [px, py]) < min_dist:
                                        valid = False
                                        break
                        if not valid:
                            break

                    if valid:
                        points.append([new_x, new_y])
                        active_list.append(len(points) - 1)
                        grid[grid_x, grid_y] = len(points) - 1
                        break

        if _ == n_trys-1:
            active_list.remove(idx)

    return np.array(points)


# poisson disk sampling
points = generate_poisson_points(width, height, seed=1)
points = np.vstack([points, [[0, 0], [0, height], [width, 0], [width, height]]])
tri = Delaunay(points)

# create polygons for each triangle
polygons = []
img_array = np.array(img.rotate(-90, expand=True))
for simplex in tri.simplices:

    # calculate average color within the triangle
    polygon = Polygon(points[simplex], closed=True)
    mask = polygon.get_path().contains_points(np.array(list(np.ndindex(width, height))))
    mask = mask.reshape(width, height)
    if not np.any(mask):
        continue

    # set the color of the polygon
    avg_color = np.mean(img_array[mask], axis=0) / 255.0
    polygon.set_facecolor(avg_color)
    polygon.set_edgecolor(avg_color)
    polygons.append(polygon)

# plot
fig, ax = plt.subplots(figsize=(width/100, height/100), dpi=100)
fig.subplots_adjust(left=0, right=1, top=1, bottom=0, wspace=0, hspace=0)
ax.add_collection(PatchCollection(polygons, match_original=True))
ax.set_xlim(20, width-20)
ax.set_ylim(0, height)
ax.axis("off")
plt.show()
